We are excited to share a new feature in the dashboard that is aimed to help make the Castle Integration more friendly and self service for developers! When you log into your Castle dashboard, in the top navigation bar, you will now find the Integration Debugger Console.
The new Debugger works with all of your Castle environments. It is made of of 4 primary sections, each of which are described in detail below:
- Event Stream
- Event Interpreter
- Search Bar
- Status Filters
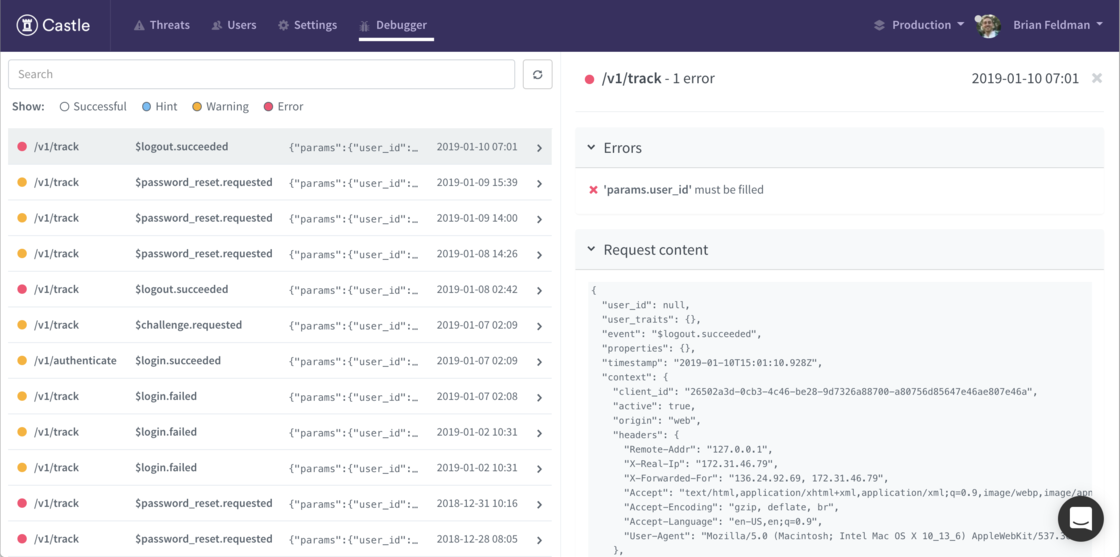
Event Stream: The Debugger’s Event Stream gives you a look at the most recent 100 events that Castle received for the currently selected environment, and shows you how they are being interpreted by Castle. For each event listed, from left to right you will see:
- Color-coded status of the event: Red means error(s) was flagged. Yellow means warning(s) were flagged. Blue states that there are some tip(s) Castle has provided to enhance the event. Green means everything looks OK. Note: If there are multiple flags on an event, it’s color-code will represent the most critical flag, Red errors being the most critical, Green being the least.
- Castle API Endpoint: To which Castle endpoint you sent this event to.
- Event Name: The name of the event that Castle received.
- Event snippet: A brief snippet of the raw JSON body of the event received.
- Timestamp: The timestamp (in your local time) for when Castle received the event.
Remember: Only the last 100 events are currently stored in the event stream. Click the Refresh button next to the search bar to reload the Event Stream with newly received events.
Event Interpreter: When you select an Event by clicking on it in the Event Stream, it will reveal the Event Interpreter on the right side of the screen. The Interpreter provides more details information on the event, including:
- Errors, Warnings, and Hints: If any are found, Castle with list out each Error, Warning, and Hint it detected when parsing the JSON body of the event. These are aimed to help you fix you Castle integration, with the goal of have every event Error, Warning, and Hint-free! Note: If you have any questions about an Error, Warning, or Hint provided, or believe it is incorrect, please take a screenshot of the full event Interpreter and share it with Castle support.
- Event Body: Castle will show you the raw JSON body of the event received. Use this to ensure that it matches what you intended to send to Castle. Make sure all parameters are present, and contain the expected keynames and values.
- Event Header: Castle will also show you the raw HTTP Headers received with the event.
Search Bar: The search bar makes it quick and easy to find the event you are looking for. Type in any string, and the Event Stream will display only those events that contain a match. The search bar allows you to search the entire event, including the JSON body. It’s great for searching for specific user-ids, IPs, or event names for example.
Status Filters: Just under the search bar are status filters. With these, you can filter the Event Stream to display only the event(s) that match at least one of the selected filters.
Note: By default, whenever you load the Debugger, the filter for Successful events will be disabled. This allows you to focus more quickly on the events that might need some more urgent attention.
Debugger Troubleshooting Tips:
- If you are debugging and do not see your event, try enabling all filters
- Wait a few seconds after sending the event and click the Refresh button
- Make sure there are no leftover searches in the search bar
- Make sure your Castle dashboard is set to the correct environment that you are testing on (in the top right of the main Nav bar)
- Try searching for the IP, User ID, or specific string that should be present in the event body
- If you are testing on an environment that has high traffic volumes, remember that the Debugger only contains the most recent 100 events, and the event you are looking for might no longer be available
Castle is a developer-founded company, and making the integration experience as smooth as possible is extremely important to us. We hope the Integration Debugger Console helps us deliver that value to you. If you have any suggestions, ideas, or comments on how we could make your developer experience better, we’d love to hear from you! Email us at support@castle.io