This is the third article in our series on anti-detect browsers. In our previous article, we analyzed Undetectable, a widely used anti-detect browser. In this article, we present two effective methods for detecting scripts—especially anti-fingerprinting scripts—that have been injected through the Chrome DevTools Protocol (CDP) in Chrome and Chromium-based browsers.
At Castle, we frequently analyze anti-detect browsers such as Undetectable to enhance our JavaScript fingerprinting signals, allowing us to better identify and mitigate fraudulent activities. Anti-detect browsers are specialized browsers designed to evade fraud detection and bot prevention systems by enabling users to easily modify or disguise their device fingerprints. Typically, these browsers achieve deception by manipulating fingerprinting signals, including canvas fingerprints, WebGL renderer details, and hardware information.
When reverse-engineering these anti-detect browsers—often based on modified Chromium versions—it's crucial to detect external processes interacting with the browser to inject and execute JavaScript. For example, many anti-detect browsers use the Page.evaluateOnNewDocument CDP command to insert JavaScript that modifies fingerprinting signals. These injected scripts are hidden from standard Chrome DevTools views, making detection challenging without specific methods.
In this article, we outline two practical approaches for detecting CDP-injected scripts, particularly focusing on anti-fingerprinting measures, in Chrome and Chromium-based browsers.
Approach 1: Using NodeJS and CDP
In the browser you analyze, you can visit chrome://gpu/ . It will provide information about the way the browser has been executed. For example, in the case of the Undetectable anti-detect browser, we see the following command line.
/Applications/Undetectable.app/Contents/chrome/Chromium.app/Contents/MacOS/Chromium
--remote-debugging-port=63401 --user-data-dir=<user-data-dir> --lang=en-US
--profile-id=<profile-id> --enable-privacy-sandbox-ads-apis
--enable-features=AllowWasmInMV3,FledgeNegativeTargeting
--disable-features=ChromeLabs
--enable-blink-features=CookieDeprecationFacilitatedTesting,FledgeBiddingAndAuctionServerAPI
--disable-blink-features=MutationEvents --enable-chrome-browser-cloud-management
--flag-switches-begin --flag-switches-end
Thus, we see that the browser is listening to CDP messages on the port 63401 . We can use NodeJS and the chrome-remote-interface package to interact with the browser instance using CDP. Once we know the port, here 63401 , we can start a CDP client that reads and writes on this port.
const CDP = require('chrome-remote-interface');

async function monitorScripts() {
    try {
        const client = await CDP({ port: 63401 }); // Connect to the remote browser
        const { Runtime, Debugger } = client;

        await Debugger.enable();
        await Runtime.enable();

        console.log("Connected to browser! Monitoring scripts...");

        // Detect script evaluation (can include evaluateOnNewDocument)
        Debugger.scriptParsed((script) => {

            // Get and print the script content
            Debugger.getScriptSource({scriptId: script.scriptId})
                .then(({scriptSource}) => {
		                // We exclude scripts with this substring since it's internal to the browser
                    if (!scriptSource.includes('VizNullHypothesis')) {
                        console.log(`Script loaded: ${script.url || '[inline script]'}\n`);
                        console.log(`Script ID: ${script.scriptId}\n`);
                        console.log('\nScript content:');
                        console.log('----------------------------------------');
                        console.log(scriptSource);
                        console.log('----------------------------------------\n');
                    }
                })
                .catch(err => {
                    console.error('Error getting script source:', err);
                });
        });

    } catch (error) {
        console.error("Error connecting to browser:", error);
    }
}

(async () => {
    await monitorScripts();
})();
The program prints all the scripts that are parsed. Thus, it’s easier to navigate to a page with no JavaScript, like example.com to more easily detect if an unknown script is injected. If that’s the case, it will print the content of the script in the terminal.
Approach 2: Using the Chrome dev tools
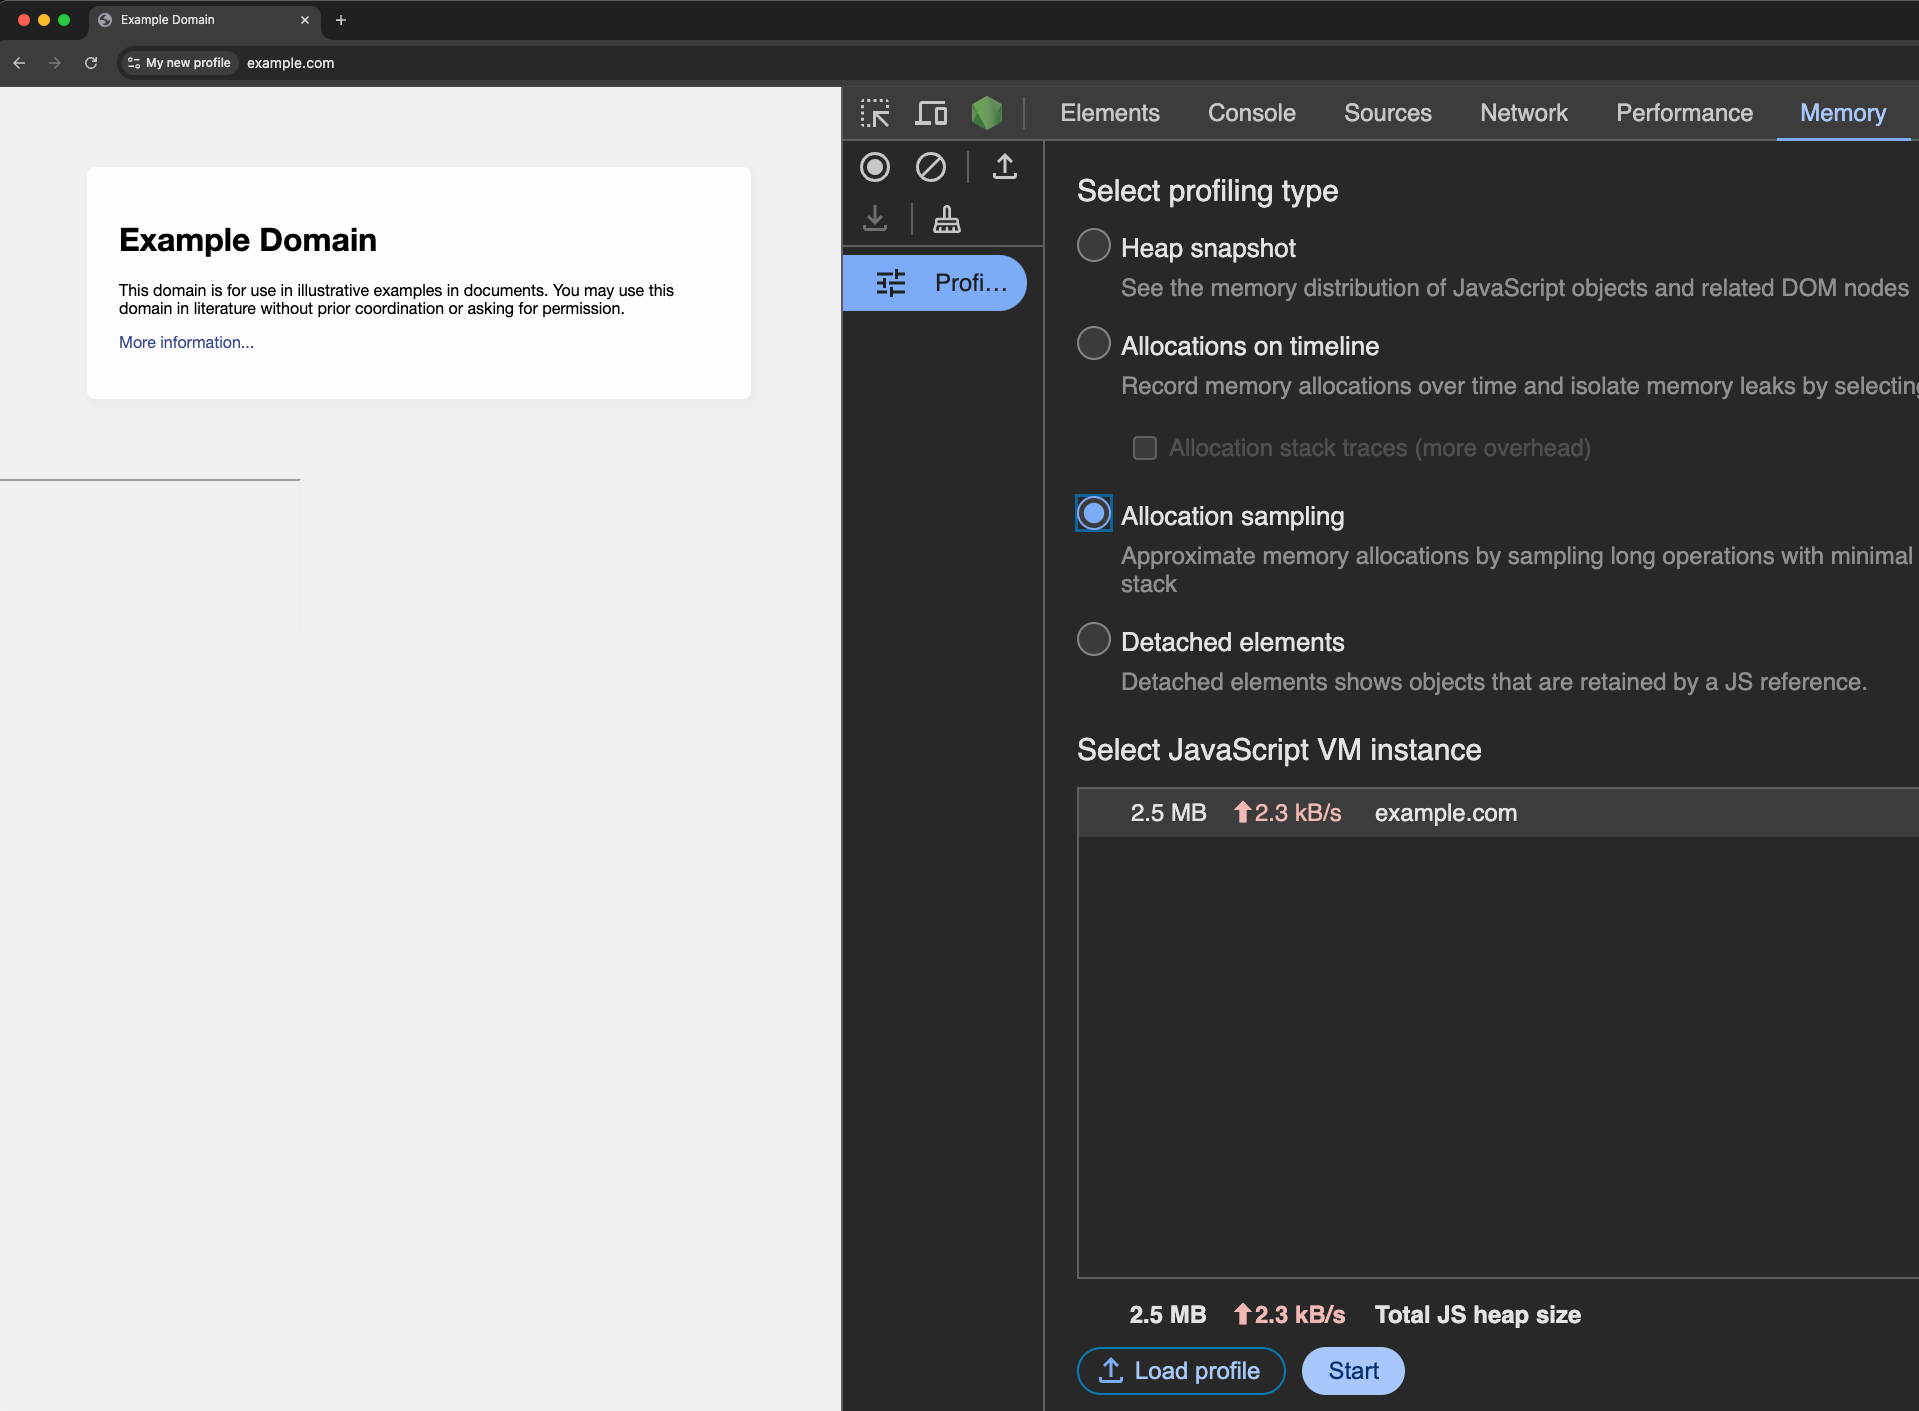
In the browser you analyze, go on a website and open the Chrome Devtools in the memory tab, cf screenshot below.

Then, click on the start button and reload the page. After reloading, you can click on stop .
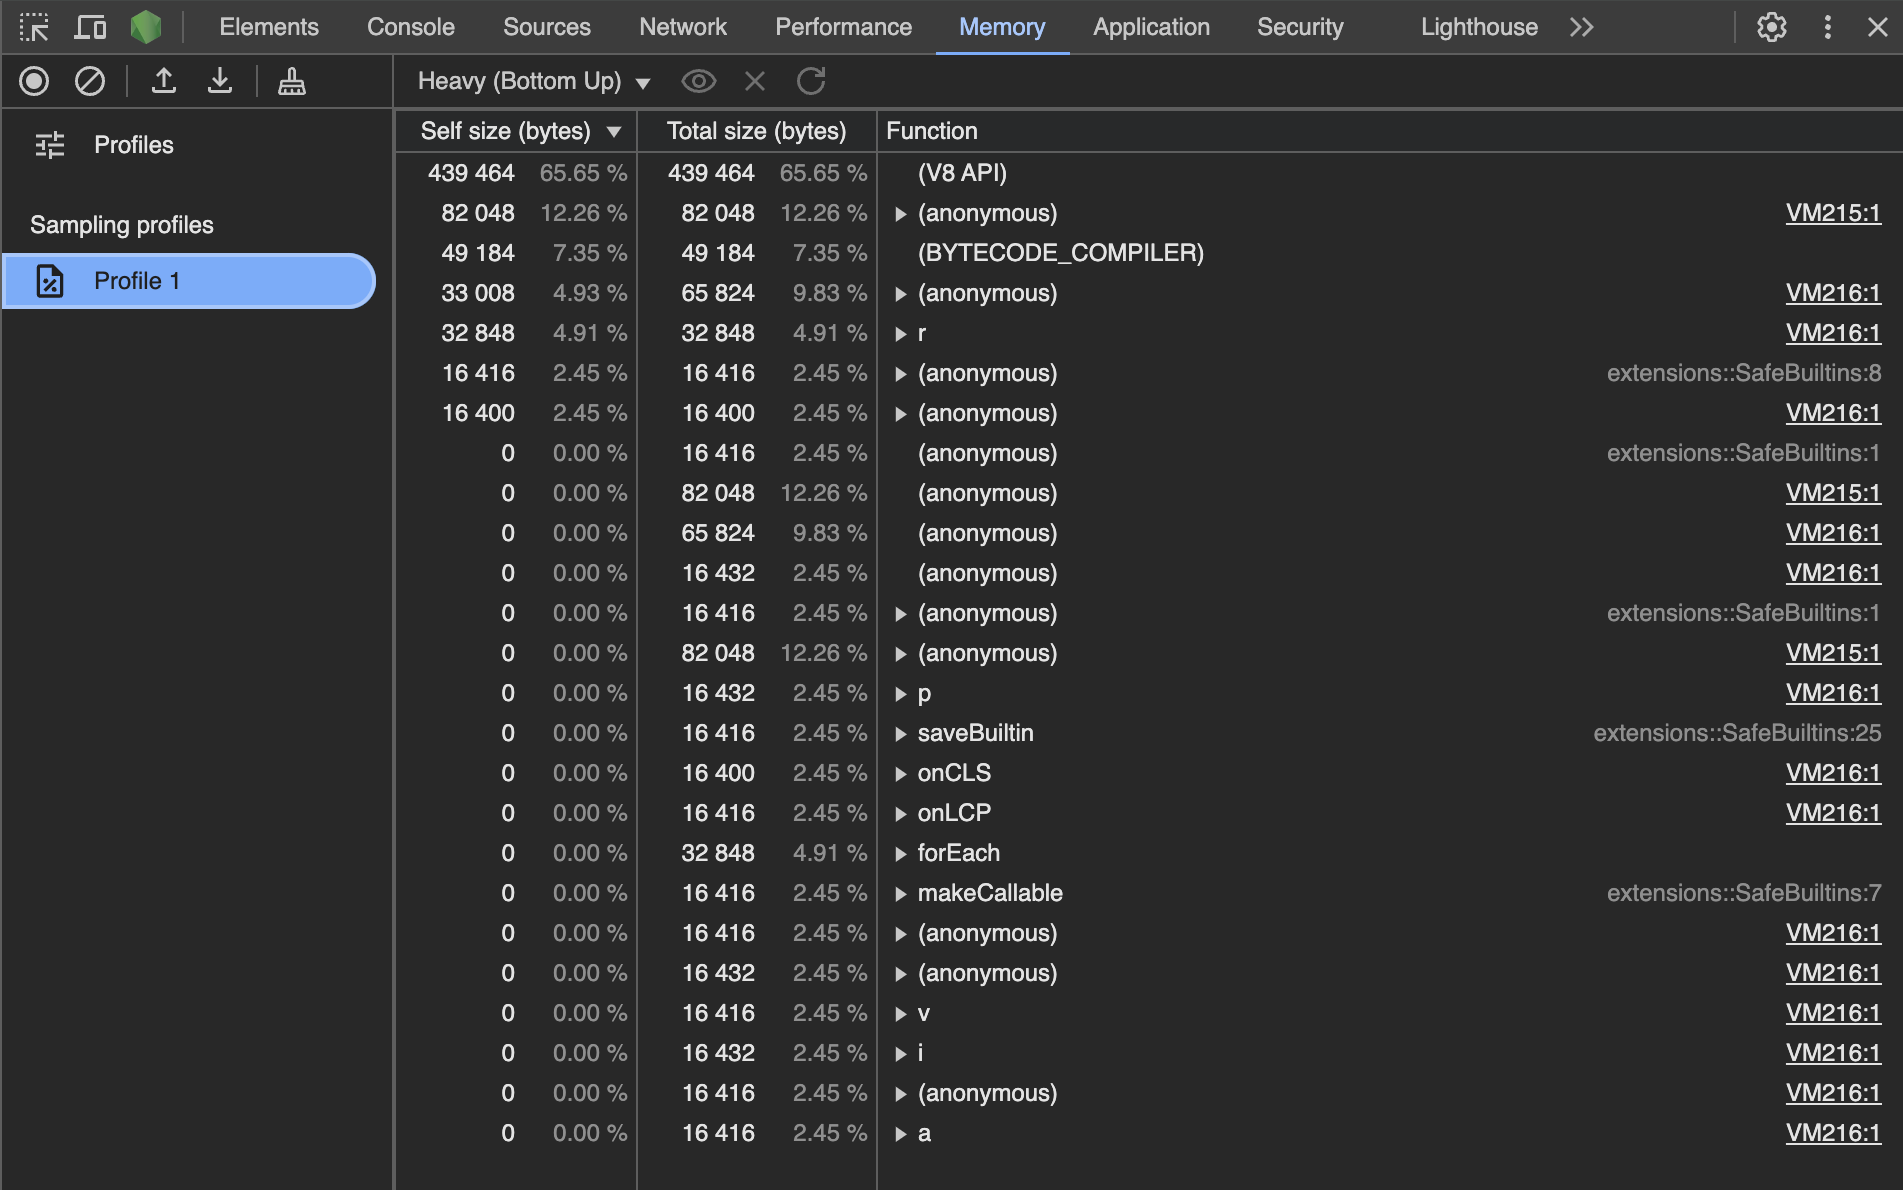
You should obtain a sampling profile that looks as follows (note that you may have more or fewer entries if the script has a lot of JavaScript running).

We observe 2 scripts:
- VM215
- VM216
If we click on VM216, we notice that it’s a JavaScript program related to Chrome Devtools metrics computations.
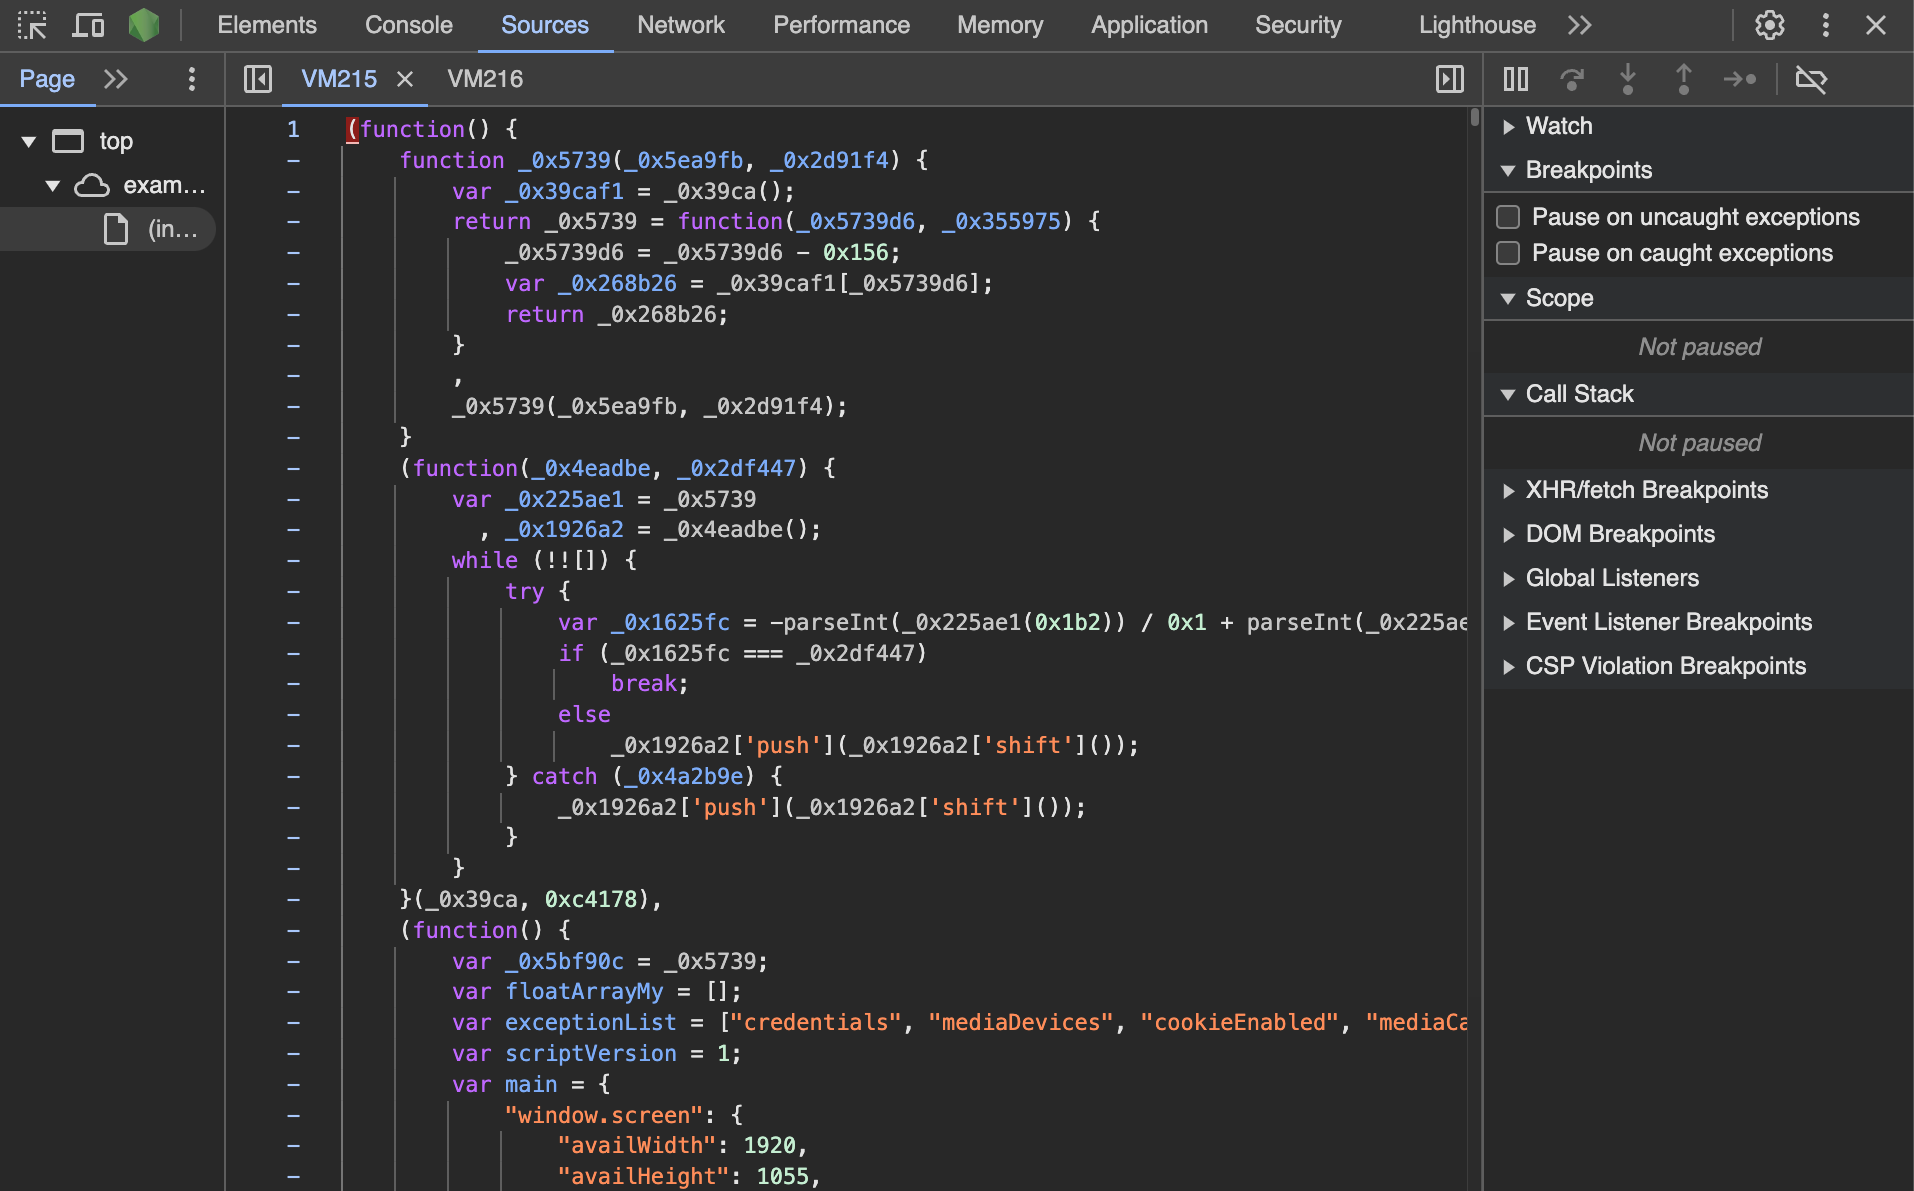
If we click on VM215, we notice it’s an obfuscated script that has been added by the Undetectable anti-detect browser in order to spoof the device's fingerprint.

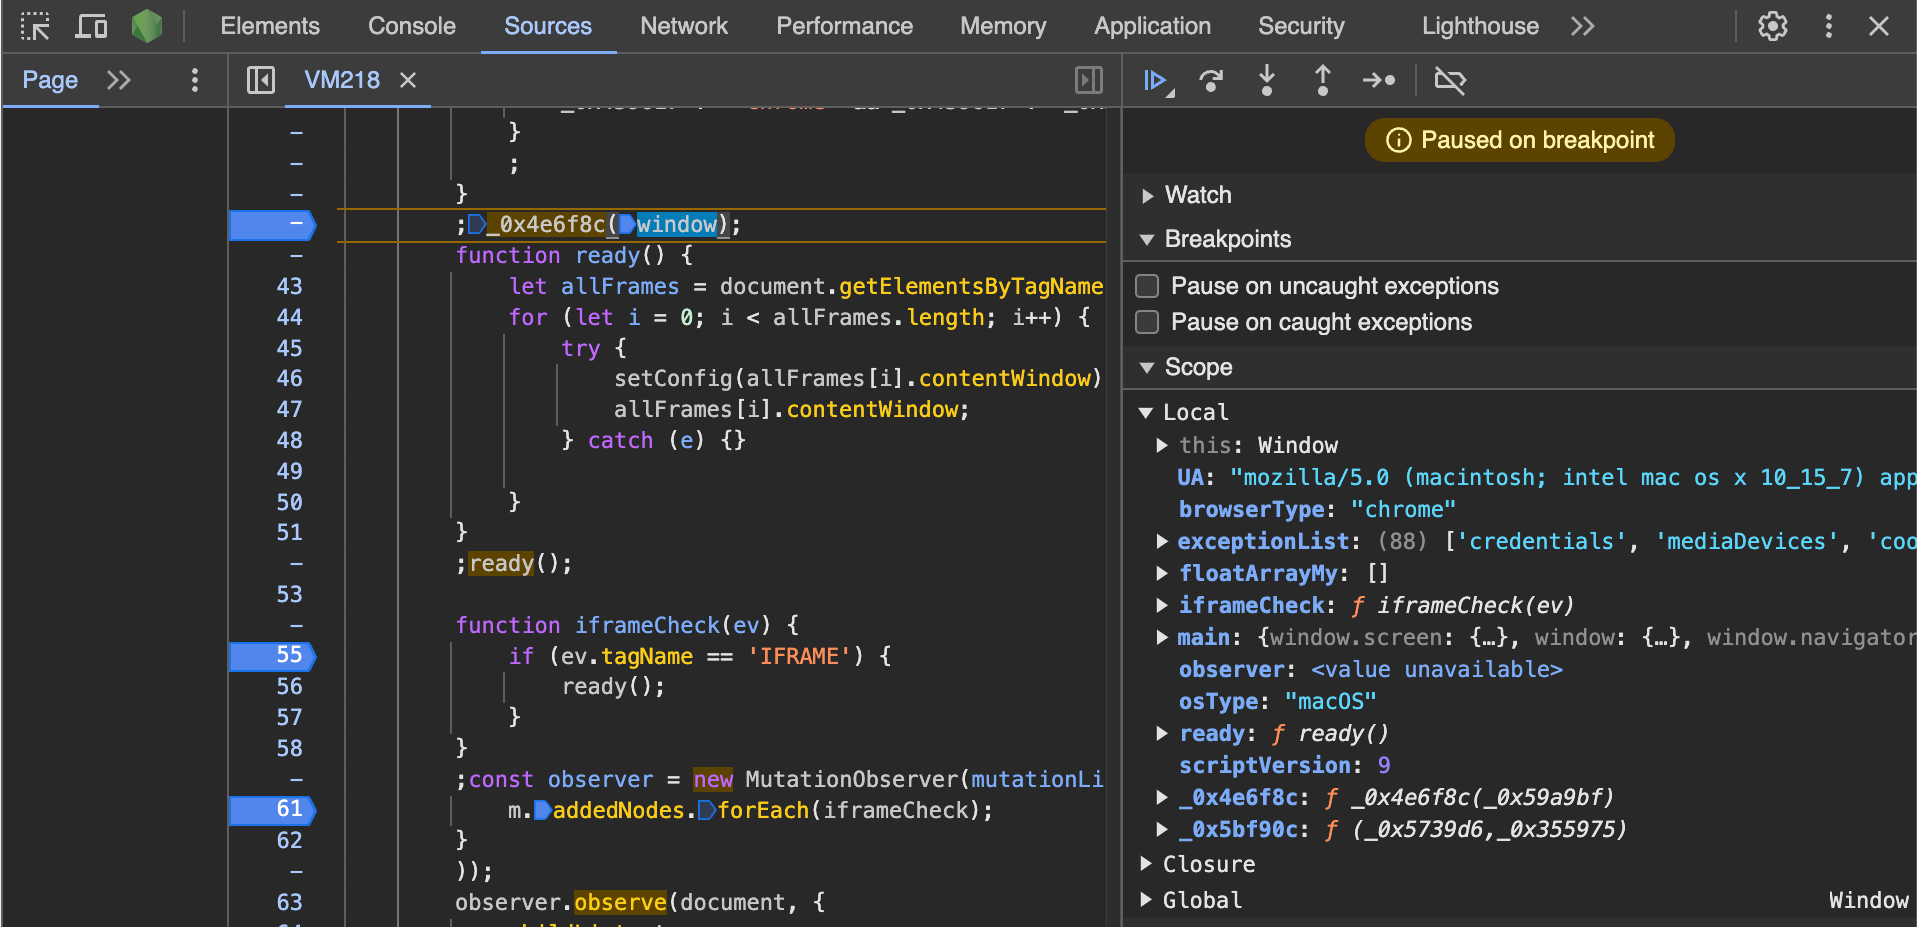
Once you have access to the script, you can set breakpoints and analyze it as any other script, which makes the reverse engineering process easier.

Technical Considerations
When analyzing anti-detect browsers to understand how they manipulate browser fingerprints, it's important to recognize that multiple methods can be employed to achieve this deception. While injecting anti-fingerprinting JavaScript through CDP is one common approach, anti-detect browsers can also:
- Utilize custom browser extensions that inject anti-fingerprinting scripts before the page loads;
- Recompile the browser to implement fingerprint spoofing at a deeper level, making it significantly harder to detect.
Thus, to better understand all the possible fingerprinting manipulation channels, it's key to also investigate the browser binary and to look at chrome://extensions/ to detect potential custom browser extensions.


