

Our mission at Castle is to equip you with the most effective tool to detect and stop bad actors within your application. In the majority of cases, stopping these bad actors is not a one time effort, but requires continuous monitoring and adaptation to stay ahead of emerging threats.
This is why we're excited to launch a new Overview Page in the Castle Dashboard. This page is designed to help you get a ten-thousand foot view of how well Castle is protecting you against these bad actors, and whether you need to do some tweaking to your controls. Together with Castle Policies, this view is putting you in complete charge over the user journeys.
We started out with a vision of having a page that would be your natural entry point to Castle to provide you with high level-insights in a digestible, familiar way. During development of this page, we were fortunate enough to get valuable feedback from our customers during interview sessions, for which we are immensely appreciative.
After multiple iterations, we’re confident that we ended up with a flow that conveys just the right amount of information.
Information hierarchy
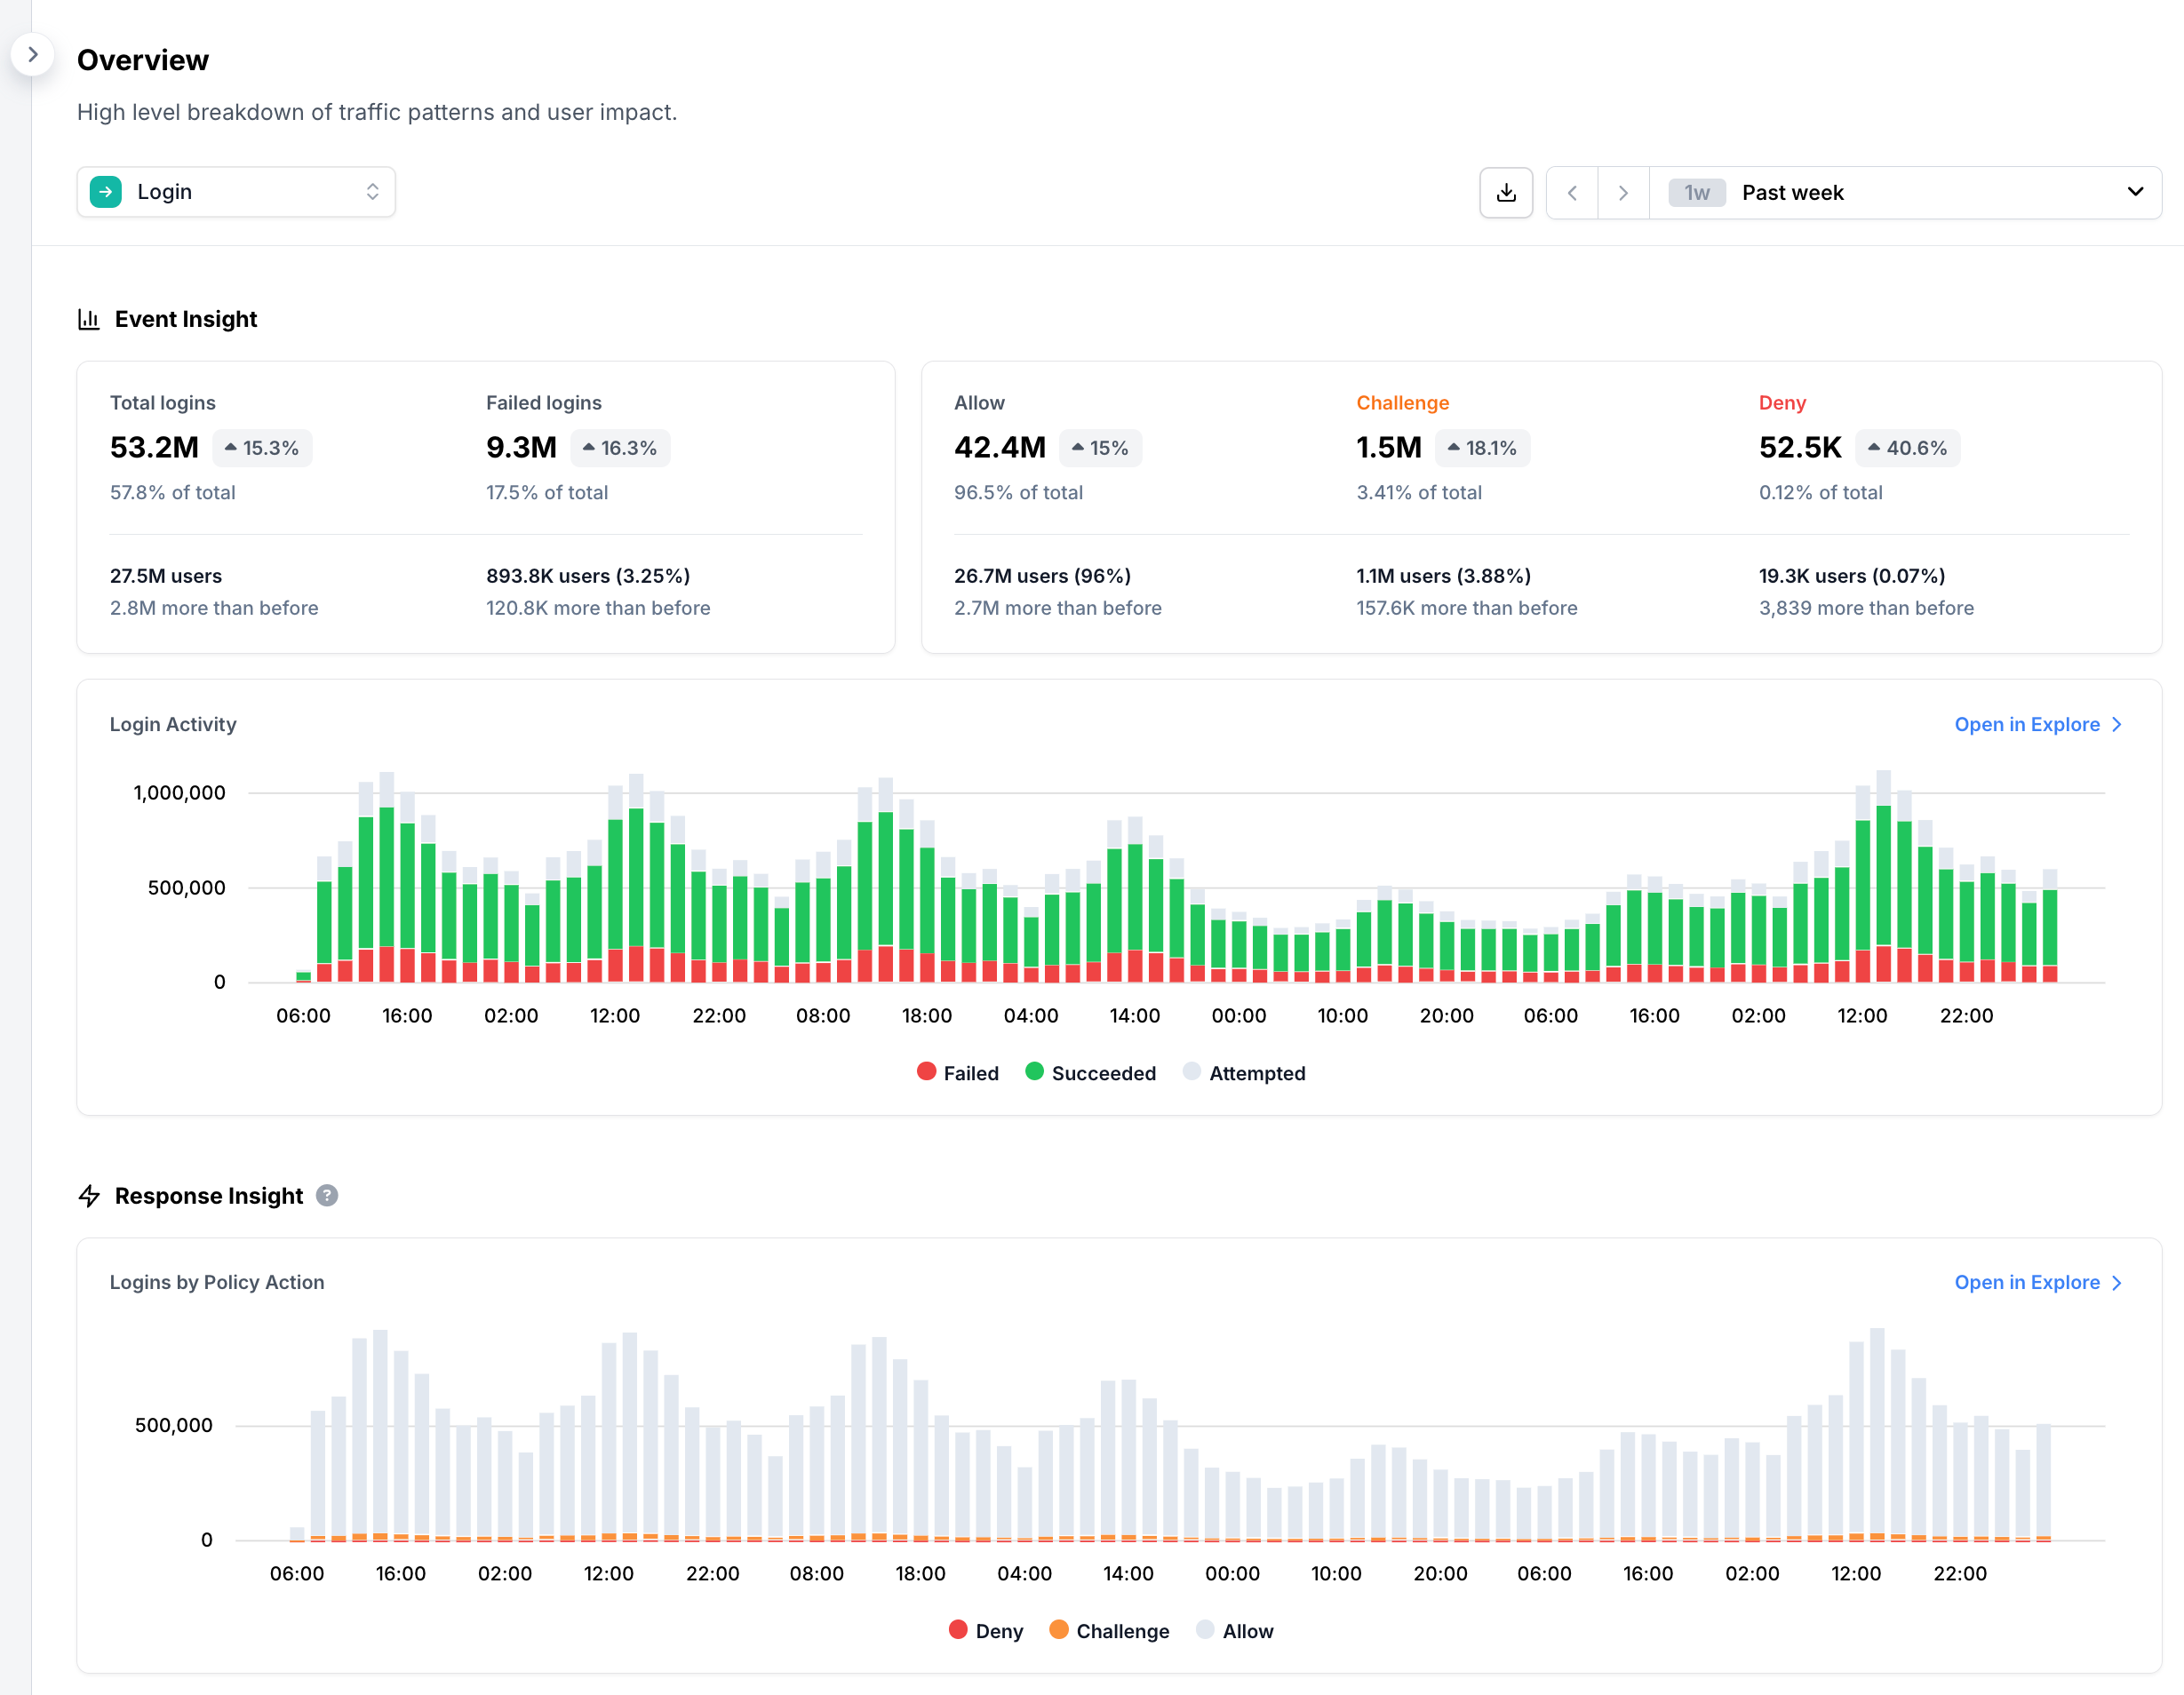
The goal was to create something that had a similar familiarity as product analytics metrics, but with actionable insights into what's being stopped or challenged by Castle. First of all, we’ve intentionally split the page into two tabs, in order to reflect the two use-cases: login and registration. On each of these pages, the information is split into three parts with separate purposes. From the top:
- The first section includes a set of numbers meant to provide an overview of what happened, to tell the story of overall volume and user impact. For example, how many users in the last week were challenged during logging in.
- The section tells you when something interesting happened. For example, observing a spike of red activity in the timeline will let you know that Castle caught and blocked an attack, allowing you to sleep better at night. Alternatively, this view quickly allows you to see that nothing out of the ordinary happened this week.
- The third section provides insight into why activity was denied or challenged by utilizing two powerful concepts in Castle: Policies and Signals. For example, did you see an uptick in datacenter activity or even credential stuffing attempts? With this section, you can quickly see which behavior dominated.
Interactivity and sharing
An important product principle for us here at Castle is interactivity: we want to encourage your curiosity to find new, interesting data points by making it easy to dive deep and zoom back out again. Based on this principle, we've made all elements on the overview page clickable, so that you can easily dig into the details.
Lastly, another important requirement with this new page: we want it to be digestible by someone who is not familiar with Castle on a day-to-day basis. With the information flow described in bullets 1-3 above, we believe we’ve created a page that can tell a good story of what happened to anyone. Whether it was how many users were impacted by additional verification at login, or that a malicious bot attack was stopped at registration, anyone who logs into the Castle Dashboard will now land on the new Overview Page. By using the share functionality, a snapshot of this page as a PDF or PNG file is shareable to anyone!
We’d love to hear what you think about this new page. How do you stay proactive when it comes to detecting bad actors in your app? How are you currently communicating security related information to your teammates and supervisors? Let us know!